Agriculture
Agriculture and its allied sectors are fundamental pillars for any economy, playing a pivotal role in ensuring food security, alleviating poverty, creating livelihoods, and stimulating growth in both industrial and service sectors. As per the Government of India's Economic Survey for 2023- 24, the agricultural sector provides essential livelihood support to approximately 42.3% of the nation's population and contributes about 18.2% to India’s GDP at current prices. To achieve comprehensive poverty eradication and foster truly inclusive growth, it's imperative that agricultural activities are closely aligned with the targets set forth by the Sustainable Development Goals (SDGs).
Kerala's Distinct Agricultural Landscape and the Imperative for Climate Resilience
Kerala's agricultural sector presents a unique case, largely defined by its small landholdings and highly diverse agro-climatic conditions, which create an ideal environment for cultivating a wide array of crops, including valuable plantation crops, cash crops, spices, and essential food crops. However, the state's agriculture has navigated a challenging decade. Factors such as climate
change, increasingly unpredictable rainfall patterns, and frequent flooding have significantly
impacted performance. Furthermore, limited crop diversification, rapid urbanization, a noticeable
migration of labour to non-agricultural jobs, and persistent labour shortages have all contributed
to a subdued agricultural output.
In direct response to these growing vulnerabilities, the Government of Kerala has intensified its
efforts to promote climate-resilient farming. The State's agricultural development initiatives,
particularly under the 14th Five-Year Plan, are strategically focused on a farm plan-based
development approach, prioritizing integrated farming systems to enhance overall crop
productivity and reignite agricultural growth across Kerala.
Among the key Initiatives and strategies for Climate-Resilient Farming in the state, Kerala
Climate Resilient Agri-Value Chain Modernization (KERA) Project is a landmark initiative.
The World Bank has approved a $200 million project aimed at significantly bolstering climate-
resilient farming and modernizing agribusiness in Kerala. This project is designed to benefit
approximately 400,000 farmers by improving their access to climate-smart agricultural practices.
Share of agriculture and allied sectors in GVA and GSVA
The share of agriculture and allied sectors in the country’s total Gross Value Added (GVA) has
been declining in the last decade. At the national-level, the share of agriculture and allied sectors
in the GVA at constant prices of 2011-12 has declined from 16.5 per cent in 2014-15 to 14.5 per
cent (P) in 2023-24. In Kerala, during the same period, it declined from 11.9 per cent to 8.3 (Q)
The yearly change at the national levels was from 15.3 per cent in 2022-23 to 14.5 per cent in
2023-24. The corresponding change in Kerala was from 8.51 per cent (P) to 8.3 per cent (Q).
Despite the declining share in GSVA the agricultural sector of Kerala has grown reasonably well
especially during the post-Covid-19 years. The annual growth recorded in 2023-24 was
significantly higher at 4.65 (Q) per cent.
Share of agriculture and allied sectors in GVA/GSVA National and State-level, at
constant prices of 2011-12
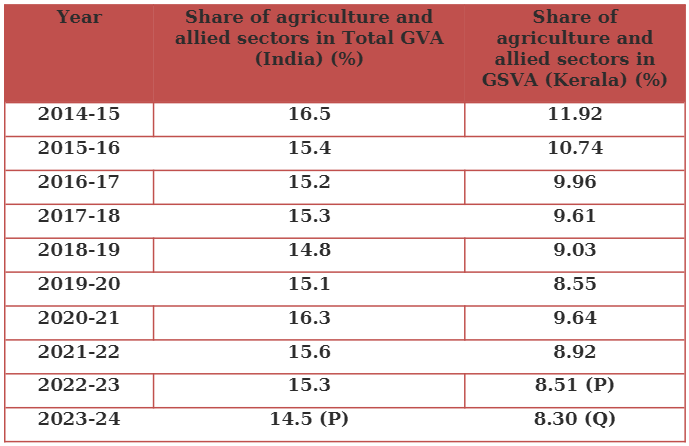
Note: (P) Provisional, (Q) Quick
Source: National Accounts Statistics 2024, GoI; Directorate of Economics and Statistics, GoK
Growth rate per annum in Gross Value Added in agriculture and allied sectors in
Kerala, 2014-15 to 2023-24
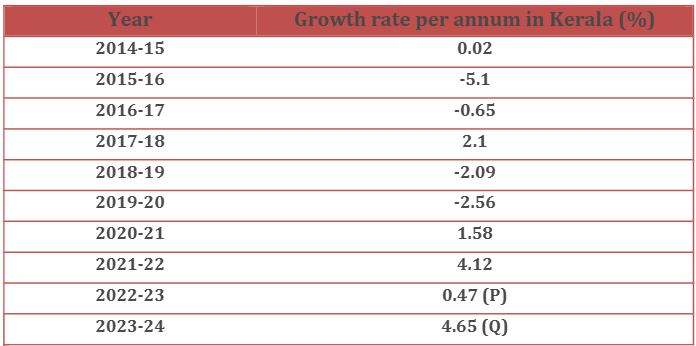
Note: (P) Provisional, (Q) Quick
Source: National Accounts Statistics 2024, GoI; Directorate of Economics and Statistics, GoK
Land use Pattern
As per the land use data, 2023-24 of the Department of Economics and Statistics, out of the total
geographical area of 38.9 lakh ha, total cropped area was 25.4 lakh ha and the net area sown was 19.7
lakh ha. Land put to non-agricultural use was 6.1 lakh ha and area under forest cover was 10.8 lakh ha
Between 2022-23 and 2023-24, the total cropped area is increased by 0.8 per cent. The area sown more
than once is increased by 7.5 per cent in 2023-24 over the previous year. The current fallow showed a
decline of 9.4 per cent. But the net sown area of the State registered a decline of 0.9 per cent. The area
under cultivable waste land reported an increase in 2023-24 by 7.5 per cent over 2022-23. The area under
land put to non-agricultural uses, fallow other than current fallow, and area under barren and uncultivated
land also recorded an increase in 2023-24 by 2.8 per cent, 2.6 per cent, and 0.2 per cent respectively.
Cropping Pattern
According to the Department of Economics and Statistics, Cropping Intensity (CI) of the State in 2023-24
was 128.6 per cent. Coconut constituted the major share of the total cropped area with 30.2 per cent
followed by rubber with 21.6 per cent. Food crops comprising of rice, pulses, tapioca, ragi, small millets,
sweet potato and other tubers constituted 9.8 per cent and plantation crops such as tea, coffee, rubber and
cardamom constituted 28 per cent of the total cropped area. Rice constituted 7.1 per cent of the total
cropped area as per the latest available data.
Agricultural Marketing
A network of wholesale and retail markets operating in both rural and urban areas facilitates the
marketing of agricultural commodities. Local market outlets are placed at various levels, facilitating marketing of the local farm produce with different modes of aggregation, either
aggregating from farmers or using a cluster-based business model.
The Department of Agriculture initiated marketing of the agricultural products under a unified
brand name Keralagro to intensify the marketing of various agricultural products produced by
farmers, FPOs, farm groups, other farmer associations and co-operatives, thereby increasing the
income of farmers and supplying agricultural products to the consumers at fair price.
VFPCK contributes significantly to strengthening the agricultural marketing system of the State
through various activities including strengthening the rural farmer markets, formation of new
bulking points and collection centers, and providing infrastructure facilities and managerial
support to the existing farmer markets. Small Farmers Agribusiness Consortium (SFAC) is an
organization under the Department of Agriculture, GoK, working for the promotion of
agribusiness for the benefit of farmers and entrepreneurs by providing necessary linkages for the
establishment and running of successful agribusiness. Formation and promotion of Farmer
Producer Organisations (FPOs) and promotion of micro, small and medium agro-processing
units are the major schemes implemented by SFAC in Kerala. FPOs being an appropriate
institutional mechanism to mobilize farmers and build their capacity for collective production
and marketing, the State Government focuses on providing a favourable environment for the
creation of new FPOs by providing necessary technical and managerial skills along with
marketing infrastructure facilities.
Crop Insurance Schemes
The crop insurance schemes under implementation in the State are the State Crop Insurance
Scheme and Restructured Weather Based Crop Insurance Scheme (RWBCIS).The State Crop
Insurance covers losses caused by natural calamities such as drought, flood, landslide,
earthquake, sea erosion, storm, hurricane, lightning, wild life menace, and forest fire. A total of
27 major agricultural crops namely coconut, arecanut, rubber, cashew, banana, tapioca,
pineapple, pepper, cardamom, ginger, turmeric, coffee, tea, cocoa, ground nut, sesamum,
vegetables, clove, betel vine, pulses, tubers, sugarcane, tobacco, paddy, nutmeg, mango, and
millets are covered under the scheme.
The Restructured Weather Based Crop Insurance Scheme (RWBCIS) is implemented by
Agriculture Insurance Company of India Ltd. (AIC). Under the scheme, each notified Panchayat
is linked to one Automatic Weather Station (AWS) or Reference Weather Station and claims are
settled for adverse weather incidence on the basis of weather data from the respective weather
stations for each notified crop. A total of 170 AWSs have been installed for the scheme in the
State. The crops notified under the scheme are paddy, banana, pepper, ginger, turmeric,
pineapple, cardamom, arecanut, nutmeg, sugarcane, cashew, clove, cocoa, coconut, mango,
millets, potato, pulses, vegetables, rubber, tapioca, tubers, and tea for Kharif season and paddy,
banana, cashew, mango, sugarcane, pineapple, potato, vegetables, cardamom, clove, cocoa,
coconut, coffee, ginger, millets, nutmeg, pepper, pulses, rubber, tapioca, tubers, turmeric, and tea
for Rabi season.
Rainfall Data
Rainfall patterns are crucial for Kerala's agriculture. Kerala's rainfall in 2024-25 exhibited high
variability, underscoring its vulnerability: Southwest Monsoon (June - September 2024):
Ended with an overall 13% deficit for the state, despite an early onset (May 30, 2024). Four
districts (Idukki, Wayanad, Ernakulam, Alappuzha) experienced significant deficiencies.
Northeast Monsoon (October - December 2024): Registered a slight 1% deficit, being largely
near-normal but with localized heavy spells. Winter Season (January - February 2025):
Recorded a significant 183% excess above the LPA, an unusual and wet period. Pre-Monsoon
(March - May 2025): Concluded with a massive 116% excess over normal. This was driven
primarily by exceptionally heavy rains in May 2025, further compounded by an early onset of
the Southwest Monsoon .This early and intense rainfall led to flash floods and rising river levels
across several districts. This erratic rainfall pattern, characterized by deficits in key monsoon
periods and substantial excesses in the lean seasons, reinforces the urgent need for robust water
management strategies and adaptive agricultural practices to mitigate climate risks and secure
livelihoods in Kerala.
Livestock Sector
The livestock sector is a vital part of the global food system and economy, and it supports the
livelihoods of many people. This sector contributes to food security, nutrition, poverty
alleviation, employment and economic growth. Livestock holdings are a crucial asset and safety
net for the poor, especially for women and income-poor groups and source of nourishment for
billions of rural and urban households. Livestock in India are raised as an integral component of
mixed farming systems. The Government provides substantial allocations to improve the sector’s
performance with respect to productivity, disease control, fodder production, value addition, and
scientific breeding practices.Milk, meat and egg are the major livestock products in the State.
The production of these three livestock products during 2018-19 to 2023-24 is shown in Figure.
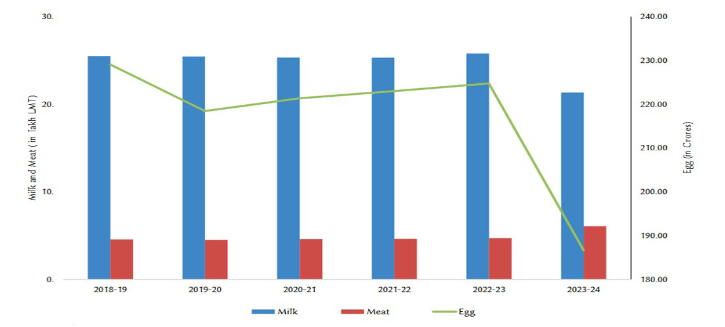
Source: Kerala State Animal Husbandry Department, GOK 2024
Fisheries Sector
The Fisheries sector plays a significant role in the economy in terms of its contribution to growth
and development. The sector provides food and nutritional security as well as employment
opportunities to a considerable number of our population. India is the second largest fish
producing country in the world and accounts for 8.92 per cent of the global fish production. The
sector has been one of the major contributors of foreign exchange earnings, with India being one
of the leading seafood exporting nations in the world. Kerala with a coastline of 590 km and an
Exclusive Economic Zone (EEZ) of 2.18 lakh sq.km has a significant marine fisheries sector.
Marine fisheries play an important role in the economy of the State. Kerala recorded 5.81 lakh
tonnes of marine fish production in 2024 and stood at third position in the country preceded by
Tamilnadu and Karnataka. Due to climate change and anthropogenic activities such as juvenile
fishing, overfishing, and unscientific fishing the catch of marine fisheries showed a declining
trend in the last decade. The inland fish production increased in 2023-24 due to the introduction
of diversified and innovative fish farming practices, across the State. The inland fish production
in 2023-24 was 2.51 lakh MT which is higher than the previous year. Kerala is the third largest
seafood exporting State in terms of quantity and second in terms of value of exports. The export
of marine products from Kerala has shown an increase from 2015-16 onwards.